What is Circle Diagram?
A circle diagram is a graphical method of representing an overall performance of an induction motor. Parameters like starting torque, the efficiency of the motor, losses in the motor, maximum power output, full-load current, power factor, slip, maximum torque, etc. It is simple and easy to construct when compared to an equivalent circuit of an induction motor.
A circle diagram can be drawn by conducting no-load and blocked-rotor (full-load) tests on the induction motor. Simply it is a diagram drawn by taking the position (locus) of the current by an induction motor for different conditions is known as a circle diagram.
How to Draw a Circle Diagram?
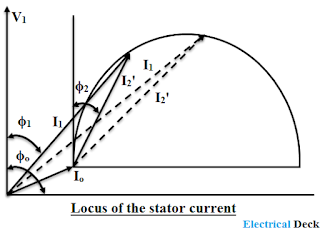
This method aims at plotting the locus of input stator current I1 for various values of slip. I1 is the phasor sum of I'2 (i.e., rotor current as referred to as a stator) and Io.
The phasor E2/X2 denotes a constant current. As seen from the above equation, the current lagging E2 by 90°, is composed of two components viz. I2 and -J R2 I2/sX2. These two components are at right angles to each other. Therefore the extremity of I2 lies on the circumference of a circle as shown in the figure below.
Since I2 & I'2 are related by a constant, the locus of I'2 is also a circle. Since I1 is the phasor sum of I'2 and Io, we can displace this circle of I'2 from the origin by the magnitude of I0. Then the extremity of I1 will lie on the circumference of the circle as shown in the figure below.
Construction of Circle Diagram :
The data available from the no-load and blocked-rotor tests are used for drawing the circle diagram. All quantities are per phase values.
The no-load current I0 and its power factor angle Φ0 can be obtained from the no-load test. The short circuit (blocked rotor) current Isc for voltage Vsc its power factor angle Φsc can be found from the blocked rotor test. This current must be converted corresponding to the rated voltage, V1 of the motor. The short-circuit current for normal voltage,
Knowing these data the circle diagram can be drawn as follows.
- Draw a vertical line representing the rated voltage V1 (reference phasor).
- Select a suitable scale for the current. Draw line OA lagging V1 by an angle Φ0 equal to No-Load current I0.
- Draw a line OB lagging V1 by an angle Φsc equal to S.C. current for normal voltage. Vector OB represents the rotor current I'1 as referred to as the stator.
- Join AB which represents the output line of the motor.
- A perpendicular bisector of the line AB is drawn cutting the horizontal line AD (drawn from A) at point C, which is the centre of the circle. Then with C as a centre and CA as a radius, draw the semi-circle ABD.
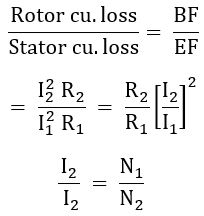
- Draw a vertical line from point B, so as to meet the line AD at point F. Now divide BF by the ratio of rotor copper loss to stator copper loss at the point E.
- Now draw a line from E to A known as the torque line (i.e., the torque generated by the motor).
Parts of Circle Diagram :
As the applied voltage V1 is drawn vertically, all vertical distances represent the power or energy components of the currents. The vertical distance AQ (Io cos Φo) represents the no-load input which supplies core loss, mechanical loss and a small stator copper loss.
1. Torque line :
Under blocked rotor condition at rated voltage, the power input is BG. This represents core loss and copper losses The intercept FG (AG) is approximately equal to core loss because the mechanical losses are absent slightly increased under blocked rotor condition.
Hence the intercept BF represents the sum of stator and rotor copper losses. Line AE separates the stator and rotor copper loss known as the torque line or rotor input line. Torque is proportional to the power input to the rotor. The rotor copper loss at standstill is BE. Therefore the line BE is known as starting torque.
2. Location of Point 'E' :
- For Cage Rotor: The input power under the blocked rotor condition is approximately equal to copper losses because the iron losses are very small and neglected. Let R1 = stator resistance per phase (found from the stator resistance test).
Stator copper loss = 3 Is2 R1
Rotor copper loss = 3 Is2 R1
- For Wound Rotor :
Let,- R1 and R2 = stator and rotor resistance per phase respectively.
- I1 and I2 = stator and rotor resistance per phase respectively.
- N1 and N2 = stator and rotor turns respectively.
- Let,
- R1 and R2 = stator and rotor resistance per phase respectively.
- I1 and I2 = stator and rotor resistance per phase respectively.
- N1 and N2 = stator and rotor turns respectively.
3. Operating Point or Full Load Point 'P' :
Draw a vertical line BL represents the full load output of the motor. From the point L draw a line parallel to the output line and it cuts the circle at two points U and P. Since the normal operating slip is small, the point P will be the operating point.
4. Full Load Current and Power Factor :
Join OP which represents the full load current of the motor. Corresponding power factor angle Φ1 (∟V1 0 P) gives the power factor at which the motor is operating.
5. Full Load Efficiency, Slip & Speed :
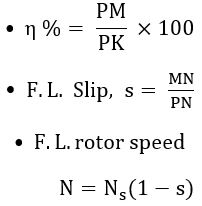
Draw a vertical line from the point P. Then PM and PK respectively represent the output and input of the motor. JK represents fixed losses, MN and NJ represent the rotor and stator copper losses respectively.
6. Maximum Output :
Draw a line parallel to the output line AB tangent to the semicircle. The actual point of contact H is obtained by drawing a perpendicular to the tangent drawn from the centre C. Now HI is the maximum output.
7. Maximum torque :
It is also known as pull out torque. Draw a line the torque line AE tangent to the semi-circle. The actual point of contact R by drawing a perpendicular to the tangent drawn from the centre C. Now RS is the maximum torque. The slip at maximum torque, sm = TS/RS.
8. Maximum Input :
It occurs at the highest point of the circle i.e., at point V where the tangent to the circle is horizontal. Now VW is the maximum input.


